VSCode Setup
A key to learning in this class is understanding how to make a GitHub Pages project. This guide will setup and run the project. At the end, you will have a student Website that can be used for blogging classroom learnings and progress.
- Starting a Project
- Software Development Life Cycle (SDLC)
- Make & DevTools Debug Lab
- Make Errors Terminal
- Make Not Found
- No Makefile Found
- No Rule to Make Target
- Missing Separator
- Permission Denied
- Command Not Found in Makefile
- Game / Browser DevTools Errors DevTools
- Collision Bug — Elements View
- Style Bug — CSS View
- CORS Error — Network View
- Logic Bug — Player / NPC Interaction
- Debug Art Challenge
- Click a number to solve its error
- Current Clue
- VSCode Commit and Sync Workflow
- HOW TO USE THIS LESSON
- ▶ LIVE GAME — CLICK TO PLAY
- LESSON 1 — WHAT IS THE CONSOLE?
- LESSON 2 — FINDING & FIXING BUGS
- LESSON 3 — THE DEBUG PROCESS
- CHALLENGE — WHY DOES THIS WORK?
- CHECKPOINT — FIX THE BUG
- VSCode & Browser Console Debugging Workflow
Starting a Project
The following commands are universal for all machine types, terminals, and projects. The previous installation steps ensured that all machine types have compatible tools. Follow these steps in order:
Open a Linux-supported Terminal
You are using Ubuntu, Kali, MacOS in this step.
Clone repository
Use same repo that you modified in vscode.dev.
Change the commands below to use your own organization name (not “opencs” of “jm1021”). This is your personal template repository (not “open-coding-society/student.git”).
For example, if your GitHub organization is jm1021 and your repo is **student, use:
   cd                # move to your home directory
   mkdir -p jm1021   # use your organization name here
   cd jm1021         # use your organization name here
   git clone https://github.com/jm1021/student.git   # use your organization/repo here
Prepare project prior to opening VS Code
   cd student # Move to your personal project directory
   ./scripts/venv.sh # Activate the virtual environment (observe the prompt change)
   source venv/bin/activate # Prefix (venv) in path
   bundle install # Ensure Ruby gems for GitHub Pages is installed in (venv)
   code . # Open the project in VS Code
Authenticate with GitHub
- At some point, you may be prompted to authenticate with GitHub. Follow the dialog and instructions.
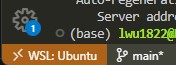
For WSL Users Only
- Ensure that VS Code is opened in WSL. Check the bottom-left corner of the VS Code window to confirm. This is critical for success!
Software Development Life Cycle (SDLC)
The development cycle involves iterative steps of running the server, making changes, testing, committing, and syncing changes to GitHub. This process ensures that your website is updated and functioning correctly both locally and on GitHub Pages.
SDLC Workflow
+-------------------+       +-------------------+       +-------------------+       +-------------------+       +-------------------+
|                   |       |                   |       |                   |       |                   |       |                   |
|   Make Server     | ----> |   Change Code     | ----> |     Commit        | ----> |      Test         | ----> |     Sync          |
|                   |       |                   |       |                   |       |                   |       |                   |
+-------------------+       +-------------------+       +-------------------+       +-------------------+       +-------------------+
        |                           |                           |                           |                           |
        v                           v                           v                           v                           v
 Start Local Server           Edit Code Files           Stage Changes Locally        Verify Local Changes        Push Changes to Cloud
Open Project and Make
All students are building a GitHub Pages website. These steps get your website running on your desktop (local or cloud).
What is make?
Think of make as a smart task helper for developers.
- It automates commands you would normally type one by one.
- It starts a localhost server on you machine, enabling Testing prior to Sync.
- It reads a special file called a Makefile, which lists tasks and how to run them.
Simply run:
make
And it will do everything listed in the Makefile.
-
Open a terminal
-
Navigate to your project directory
-
Activate virtual environment (venv)
source venv/bin/activate -
Open VSCode
code . -
Open a VSCode Terminal
-
Type
makeThis runs a build to a local server. Repeat this command as often as you make changes. -
Hover then Cmd or Ctl Click on the localhost Server Address http://localhost: … provided in the terminal output from the make command.
### Congratulations!!! An output similar to below means tool and equipment success ###
(venv) johnmortensen@Mac pages % make
Stopping server...
Stopping logging process...
Starting server with current config/Gemfile...
Server PID: 40638
appending output to nohup.out
Server started in 17 seconds
    Server address: http://localhost:4500/
Terminal logging starting, watching server for regeneration...
Server started in 0 seconds
Configuration file: /Users/johnmortensen/opencs/pages/_config.yml
            Source: /Users/johnmortensen/opencs/pages
       Destination: /Users/johnmortensen/opencs/pages/_site
 Incremental build: enabled
      Generating...
      Remote Theme: Using theme jekyll/minima
                    done in 16.396 seconds.
 Auto-regeneration: enabled for '/Users/johnmortensen/opencs/pages'
    Server address: http://localhost:4500/
Make workflow (local build: make, make dev, make clean, make stop, make convert)
These commands are used to build and manage a localhost version of the website. The purpose of this is to verify and test code changes prior to pushing changes to GitHub Pages.
-
make: Runs the full local server with all features and document overhead. -
make dev: Runs a minimal, faster build intended for developers actively coding. Skips heavy document processing so the server starts and regenerates quickly. Use this when you are iterating on game logic, layouts, or interactive features and want rapid feedback. -
make clean: Stops the local server and cleans the build files. Try this after rename as it could cause duplicates in build. -
make stop: Stops the local server. This means you will be unable to access your blog on http://localhost until you runmakeagain. -
make convert: Converts Jupyter Notebook files. Run this if your.ipynbfiles are not updating on the server; it may assist in finding the error.
Make Debug Lab — Interactive Practice
Got errors? This interactive lab covers common make errors and browser DevTools debugging scenarios. Use the Learn tab for a quick reference, then test yourself in Practice by solving errors to reveal pixel art.
Click to open the Make Debug Lab
Make & DevTools Debug Lab
Learn to resolve common make errors and use browser DevTools to debug game issues
Make Errors Terminal
Make Not Found
Your system does not have make installed.
No Makefile Found
Make cannot find the Makefile. You are probably in the wrong directory.
No Rule to Make Target
The target you specified does not exist. Check for typos.
Missing Separator
Commands in Makefiles must be indented with TAB characters, not spaces.
Permission Denied
The script does not have execute permissions.
Command Not Found in Makefile
/bin/sh: python3: command not found
The Makefile is trying to run a command that is not installed.
Game / Browser DevTools Errors DevTools
When building or debugging a game in your GitHub Pages project, use browser DevTools (F12 or Cmd+Option+I) to diagnose these common issues. Run make dev for a fast local server while iterating on game code.
Collision Bug — Elements View
The collision box does not match the visible sprite. Inspect the element to see its real size and position.
Style Bug — CSS View
A style rule is overriding your intended CSS. Use the Styles panel to find the conflict.
CORS Error — Network View
Your game is fetching data (NPC configs, maps, scores) from a server that has not allowed your origin. Check the Network tab to diagnose.
Access-Control-Allow-Origin — if missing or wrong, the server must add itmake dev, proxy the request through your Jekyll server or use a CORS-friendly test APILogic Bug — Player / NPC Interaction
The interaction condition in your game logic has a bug. Use the Console and Sources tabs to step through the code.
console.log calls inside your interaction handlerisNearNPC)Debug Art Challenge
Answer error clues correctly to reveal the hidden pixel art — now with DevTools challenges!
Click a number to solve its error
Current Clue
VSCode Commit and Sync Workflow
All students will be writing and changing code. These steps allow you to change the website, first locally and then on public location.
+-------------------+       +-------------------+       +-------------------+       +-------------------+
|                   |       |                   |       |                   |       |                   |
|   VS Code Editor  | ----> |   Local Git Repo  | ----> |   Remote GitHub   | ----> |   GitHub Pages    |
|                   |       |                   |       |                   |       |                   |
+-------------------+       +-------------------+       +-------------------+       +-------------------+
        |                           |                           |                           |
        |                           |                           |                           |
        v                           v                           v                           v
    Save Files                Commit Changes               Sync Changes                Public Website
   Local Website
Detailed SDLC Steps
The SDLC adds the important steps of Make and Test to the workflow. This ensures that you never sync code that is broken locally. This helps the developer troubleshoot errors early and as you are working.
-
Save Files in VS Code:
- Edit your files.
- Save the changes (Cmd + S on Mac or Ctrl + S on Windows/Linux).
- Verify changes on the local web server.
-
Commit Changes in VS Code:
- Click on the “Source Control” icon in the left sidebar.
- Stage your changes by clicking the plus sign next to the files.
- Enter a commit message.
- Click the “Commit” button.
-
Test Changes on Local Server:
- Open Terminal.
- Be sure the “(venv)” prefix is in the prompt.
- Type
makein the prompt (runmake). - If you are actively developing a game or interactive feature, use
make devinstead — it skips heavy document processing for a faster build cycle. - If successful, you will see log output in the prompt:
Server address: http://localhost:4500/- If delayed open 2nd terminal using + and execute command
cat \tmp\jekyl4500.log. This keeps ongoing history of logs if things are right a below, if things are wrong you will see errors.
(venv) johnmortensen@Mac pages % cat /tmp/jekyll4500.log Configuration file: /Users/johnmortensen/opencs/pages/_config.yml Source: /Users/johnmortensen/opencs/pages Destination: /Users/johnmortensen/opencs/pages/_site Incremental build: enabled Generating... Remote Theme: Using theme jekyll/minima done in 16.396 seconds. Auto-regeneration: enabled for '/Users/johnmortensen/opencs/pages' Server address: http://localhost:4500/ Server running... press ctrl-c to stop. Regenerating: 1 file(s) changed at 2025-11-20 06:20:27 _posts/Foundation/B-tools_and_equipment/2025-04-15-tools_setup-vscode.md Remote Theme: Using theme jekyll/minima ...done in 16.992685 seconds. Regenerating: 1 file(s) changed at 2025-11-20 06:22:30 _posts/Foundation/B-tools_and_equipment/2025-04-15-tools_setup-vscode.md Remote Theme: Using theme jekyll/minima ...done in 16.763741 seconds.- Open the localhost Server address in deskop or cloud computer browser
http://localhost:4500/ - Test your changes before you commit.
- Errors in terminal
- Most likely cause is
(venv)in prompt(venv) johnmortensen@Mac pages %. This will fail 100% of the time - If there are errors in coding the will show in terminal (with a delay/timeout) and be in log:
cat /tmp/jekyll4500.log - Most likely error, is what you just changed!!! Easiest fix is to undo, see if it fixes things. Then try again.
- Most likely cause is
- Regeneration messages
- Most changes will show regeneration message in terminal after you save file.
- If you see a message in terminal like the one below, you can test your localhost change by refreshing page you are working on.
Regenerating: 1 file(s) changed at 2025-11-20 06:40:18 _posts/Foundation/B-tools_and_equipment/2025-04-15-tools_setup-vscode.md Remote Theme: Using theme jekyll/minima ...done in 16.537365 seconds. -
Sync Changes to GitHub:
- Never sync changes before you test, as this activates Actions on GitHub.
- Click the “Sync Changes” button in the Source Control view.
- This pushes your local commits to the remote GitHub repository.
-
Update GitHub Pages:
- GitHub Pages Action automatically rebuilds your site with the latest changes.
- Visit your public website at https://
.github.io/student to see the updates.
flowchart TD
    A[Run Server] --> B[Make Changes]
    B --> C[Commit]
    C --> D[Test]
    D --> E{Tests Pass?}
    E -- Yes --> F[Sync]
    E -- No  --> B

   style E fill:#FF0000
Debugging with
Rock Paper Scissors
Play the game by clicking the icons, or open your browser console and type commands directly.
Each lesson teaches a real debugging concept using the game.
HOW TO USE THIS LESSON
Press F12 (Windows) or Cmd+Opt+I (Mac), then click the Console tab.
Click "▶ Run Broken" on any error card to see what the error looks like — just like a real console!
Hit "[*] Auto-Fix" to instantly patch the bug and watch the game play. See exactly what changed!
Try it yourself! Type playRPS("rock") in your real browser console to control the game live.
▶ LIVE GAME — CLICK TO PLAY
LESSON 1 — WHAT IS THE CONSOLE?
The browser console lets you run JavaScript live on any page — no file editing needed. This game is already loaded, so you can control it directly from there.
- Press F12 (or Cmd+Option+I on Mac) to open DevTools
- Click the Console tab at the top
- Type
playRPS("rock")and press Enter - Watch the battle animation above respond in real time!
- Try
rock.rotate(45)orpaper.setBorder("3px solid lime")to customize images
LESSON 2 — FINDING & FIXING BUGS
Each card below shows a real bug. Click ▶ Run Broken to see the simulated error, then use [*] Auto-Fix to patch the code automatically and play — or ▶ Run Fixed to just see the correct result.
playRPS(rock)

Without quotes, JavaScript thinks rock is a variable name — but no variable called rock exists. It looks for rock as a declared variable, fails, and throws an error.
rock and throws a ReferenceError when it can't find one. Always wrap text in "quotes".
playRPS("lizard")


"lizard" isn't one of the three valid choices. The function checks your input against an allowed list and rejects anything not on it.
["rock","paper","scissors"]. If .includes() returns false, the function rejects the call. Always pass a value that the function is designed to accept.
playRps("paper")
JavaScript is case-sensitive. playRps and playRPS are two completely different identifiers — only one of them exists.
R, P, and S are uppercase in playRPS. playRps does not exist as a function, so JS throws a TypeError.
LESSON 3 — THE DEBUG PROCESS
- Read the error message — it pinpoints the problem (line, type, description)
- Check spelling & capitalization —
playRPS≠playRps - Check your inputs — strings need quotes, values must be valid
- Run the fix and verify in the console output
- Test edge cases — what happens with
"ROCK","", or123?
CHALLENGE — WHY DOES THIS WORK?
Try this — it uses all-caps but still plays correctly:
.toLowerCase() on your input before checking it. So "ROCK", "Rock", and "rock" all work. That technique is called defensive programming — making code resilient to small user mistakes.
CHECKPOINT — FIX THE BUG
The code below has an error. Type the corrected version in the box and press Run:
VSCode & Browser Console Debugging Workflow
All students will encounter bugs in their code. These steps help you find and fix errors using both VSCode’s built-in debugger and the browser’s developer console.
+-------------------+       +-------------------+       +-------------------+       +-------------------+
|                   |       |                   |       |                   |       |                   |
|   VS Code Editor  | ----> |  VSCode Debugger  | ----> |  Browser Console  | ----> |   Fix & Re-Test   |
|                   |       |                   |       |                   |       |                   |
+-------------------+       +-------------------+       +-------------------+       +-------------------+
        |                           |                           |                           |
        |                           |                           |                           |
        v                           v                           v                           v
   Write/Edit Code           Set Breakpoints             Inspect Errors              Commit Working Fix
                             Inspect Variables           Check Network/Logs
Detailed Debugging Steps
Debugging is part of the SDLC. Always debug locally before syncing to GitHub. Use VSCode and the browser console together to isolate and fix issues quickly.
-
Reproduce the Bug in VSCode:
- Run your local server (
makeormake dev). - Confirm the bug appears at
http://localhost:4500/. - Note the exact conditions that trigger it (what page, what action, what input).
- Run your local server (
-
Set Breakpoints in VSCode:
- Open the file where you suspect the bug.
- Click in the gutter (left margin) next to a line number to set a red breakpoint dot.
- Open the Run and Debug panel (Ctrl+Shift+D / Cmd+Shift+D).
- Click “Start Debugging” (F5) or use the play button.
-
Inspect Variables in the Debugger:
- When code hits a breakpoint, execution pauses.
- Check the Variables panel on the left to see current values.
- Hover over any variable in the editor to see its value inline.
- Use the Watch panel to track specific expressions (e.g.,
myArray.length). - Use the Debug Console (bottom panel) to run live expressions:
> myVariable 42 > typeof myVariable "number" -
Step Through Code:
- Step Over (F10): Run the next line without going into functions.
- Step Into (F11): Jump inside a function call.
- Step Out (Shift+F11): Finish current function and return to caller.
- Continue (F5): Resume until the next breakpoint.
Paused at line 24 → Step Over → Step Into → Inspect → Continue -
Open Browser Developer Console:
- In Chrome/Edge: press F12 or right-click → Inspect → Console tab.
- In Firefox: press F12 → Console tab.
- Look for red error messages — these pinpoint the file and line number.
- Use
console.log()in your code to print values at key points:
console.log("Value of x:", x); console.log("Array contents:", myArray); -
Read Error Messages Carefully:
- Most errors include a file name and line number — go there first.
- Common error types:
Error Type What It Means Likely Fix ReferenceErrorVariable not defined Check spelling, scope TypeErrorWrong data type used Check variable value/type SyntaxErrorBad code structure Check brackets, commas 404 Not FoundFile/resource missing Check file path/name UncaughtprefixError not handled Wrap in try/catch -
Use the Network Tab (for API/resource issues):
- In DevTools, click the Network tab.
- Refresh the page — all requests appear here.
- Red rows = failed requests. Click them to see the status code and response.
- Filter by
XHRorFetchto isolate API calls.
-
Fix the Bug and Re-Test:
- Make the smallest change that fixes the problem.
- Save and watch for the Regeneration message in terminal.
- Refresh
http://localhost:4500/and verify the bug is gone. - Remove any temporary
console.log()statements before committing.
-
Commit the Fix:
- Only commit once the bug is confirmed fixed locally.
- Write a clear commit message describing what was broken and how it was fixed:
Fix: corrected undefined variable in navbar.js (line 24)- Then follow the standard Sync workflow — never sync broken code.
flowchart TD
    A[Bug Observed on Localhost] --> B[Set Breakpoint in VSCode]
    B --> C[Start Debugger / F5]
    C --> D[Inspect Variables & Step Through Code]
    D --> E[Open Browser Console]
    E --> F[Read Error Message + Line Number]
    F --> G{Root Cause Found?}
    G -- No --> H[Add console.log / Check Network Tab]
    H --> F
    G -- Yes --> I[Make Fix]
    I --> J[Re-Test on Localhost]
    J --> K{Bug Fixed?}
    K -- No --> B
    K -- Yes --> L[Remove debug logs]
    L --> M[Commit Fix & Sync]

    style G fill:#FF0000
    style K fill:#FF0000